Beware the Man Who Brings a Graph to Show What a Statistic Reveals More Precisely
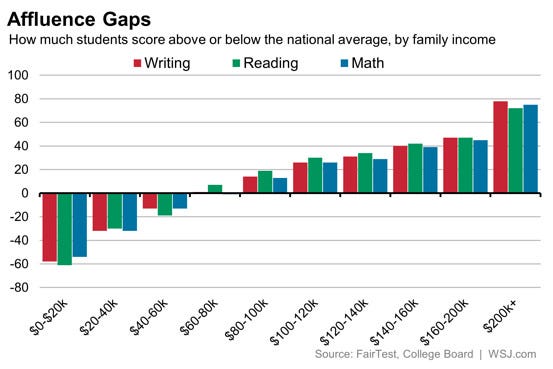
The above graphic, from an old Wall Street Journal article, is just one of many similar graphs that get floated around on social media when people rail against the SAT. “Look!” they shout. “It’s just an income test! The SATs just tell you who the rich kids are.” Well, elite colleges are very invested in harvesting rich kids, yes, but the SAT is not the problem. This particular graphic is specifically misleading in the scale of its Y-axis - these are 800-point tests, and yet the total range of the Y-axis is 180 points, making the effect seem misleadingly large. But it’s also just weird to try and represent a simple correlation with a graph in this context. We have specific statistics that reflect what these graphs try to depict, the amount of variation in one number (in this case SAT scores) that is predictable from another number (family income). In particular, the coefficient of determination or r² is designed for exactly this purpose. What does r² tell us in this instance? Well, Sackett et al (2012) is the largest and most representative dataset of this type of which I’m aware. And across 150,000 students, they observe an r² of .0625 when regressing SAT scores and family income. That is to say, if we imagine a big pool of 100% of the variance in SAT scores, we can only predict 6.25% of that variance based on family income. And yet this condition is constantly used to insist that the SAT is “just a wealth test”!
The above graph is no doubt pulled from a different dataset, and you do see slightly higher r² figures in some research. But all of the data of which I’m aware is more like Sackett than not - consistently, familial income just isn’t a very strong predictor of SAT scores, no matter what Twitter tells you. And, given that SAT scores are not easily modified with tutoring, it’s truly strange that the very-real phenomenon of rich students having a leg up in college admissions is blamed on the test. If you can get a “college counselor” (read: mercenary who you pay to get your kid into college) to talk to you frankly, they’ll tell you that the SAT is the hardest element for rich families to game. But because our discussions on race and class privilege are always tissue-thin, and because so many people harbor personal resentments for the SAT because of the stress of taking it themselves, it’s powerfully difficult to get the establishment media to reflect on any of this.
Of course, there’s an added layer: the “antiracist” worldview holds that racial and class inequality amount to powerful obstacles for Black and poor students, which certainly is true. But if the SAT reflects race and class effects - much smaller than critics think, but real enough - isn’t that exactly what left-leaning people should expect? If you think our society is full of racial and socioeconomic privilege, wouldn’t it be bizarre to expect our educational tests to fail to reflect that reality? And wouldn’t getting rid of such tests amount to voluntarily abandoning a powerful tool for demonstrating the continuing salience of such inequality?
Correction: Got my numbers jumbled. Commenter Sean points to
In the 2006 national population of test takers, the correlation between SES and composite SAT score was .46. Therefore, 21.2% of variance in SAT scores is shared with SES, as measured here as a composite of mother’s education, father’s education, and parental income. Thus, SAT scores are by no means isomorphic with SES, although the source of the SES-SAT relationship is likely due to some combination of educational opportunity, school quality, peer effects, and other social factors.
Broader point remains - no reason to use graphs when stats are more accurate, relationship is much weaker than people think and certainly not consistent with “just an income test,” and some income effect is exactly what left leaning people should expect. Also there's the question of where the causation goes the other way and rich people are smarter, which again fits with a progressive economic perspective.


People talk as if attending a selective college makes the students smarter and earn more.
It's pretty obviously the other way around - smart people win. They win everything - exclusive college admittance, top jobs, high incomes, social status.
Of course they do - they're smart. If "smart" doesn't mean "the ability to find ways to win", then whatever does it mean?
I think this -
"And across 150,000 students, they observe an r² of .0625 when regressing SAT scores and family income."
- might be inaccurate. They regress *freshman GPA* on SES (and SAT and HS GPA) and find r² of 0.068.
You write:
"We have specific statistics that reflect what these graphs try to depict, the amount of variation in one number (in this case SAT scores) that is predictable from another number (family income)"
Sackett et al write: "In the 2006 national population of test takers, the correlation between SES and composite SAT score was .46. Therefore, 21.2% of variance in SAT scores is shared with SES, as measured here as a composite of mother’s education, father’s education, and parental income. Thus, SAT scores are by no means isomorphic with SES, although the source of the SES-SAT relationship is likely due to some combination of educational opportunity, school quality, peer effects, and other social factors."
So I think r² might be 0.212, not 0.0625, in the original sentence.
https://citeseerx.ist.psu.edu/document?repid=rep1&type=pdf&doi=316b3e2f17c886d44700b835118965767cf897ce